


It seems we can’t find what you’re looking for. Perhaps searching can help.
All articles
Category

Topic

Newest
WHAT IS BI? 5 BUSINESS INTELLIGENCE TOOLS FOR ENTERPRISES
Trong thời đại thương mại điện tử đang ngày càng lên ngôi như hiện nay, việc thu thập, phân tích và ứng dụng thông tin kinh doanh là một yếu tố quan trọng để nắm bắt được các cơ hội mới trong thị trường.
In the current era dominated by eCommerce, gathering, analyzing, and applying business information is crucial to seize new opportunities in the market. Business intelligence (BI) can be an invaluable tool for managing corporate data for enterprises.
So, what is Business Intelligence, and what makes it the perfect choice for large businesses?
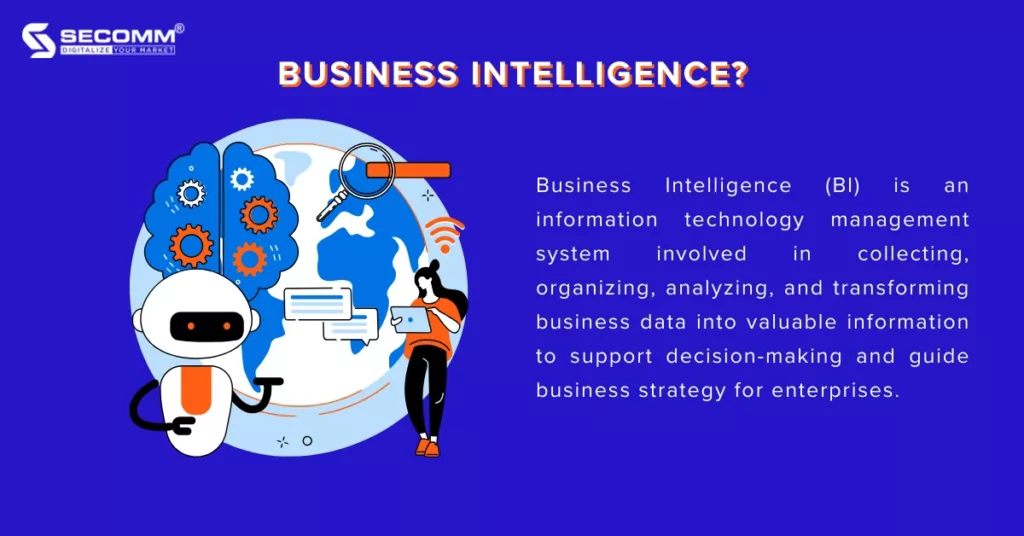
What is Business Intelligence?
Business Intelligence (BI), often referred to as intelligent business or corporate intelligence, is an information technology management system involved in collecting, organizing, analyzing, and transforming business data into valuable information to support decision-making and guide business strategy for enterprises.
BI systems help businesses track and measure key business performance indicators such as revenue, profit, profitability, customer satisfaction, consumer behaviour, favourite products, etc. Through the analysis and comparison of this collected data, BI systems enable the visualization of trends and the most suitable business models, thereby assisting corporate managers in developing appropriate business strategies.
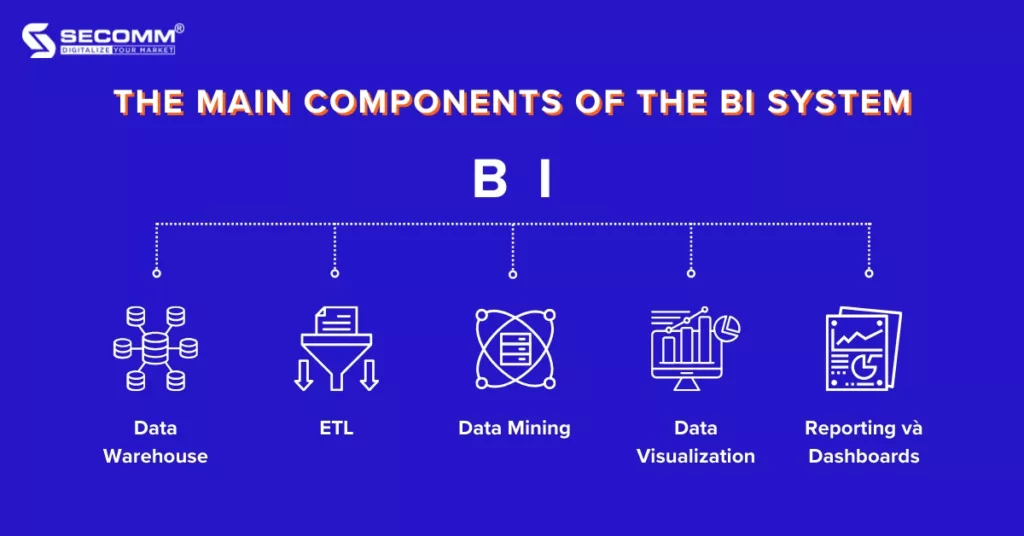
The main components of the BI system
A BI system is a collection of technologies, tools, and methods used to deploy the BI process in a business. This BI system typically includes components such as:
- Data Warehouse: This is where all business data from various sources is stored. The Data Warehouse is designed to aggregate and store data in a standard structure, easily accessible, ensuring consistency and reliability of data for analysis activities.
- ETL (Extract, Transform, Load): The ETL process involves extracting data from sources, applying rules and transformation processes to standardize data, and then loading the transformed data into the Data Warehouse.
- Data Mining: This is the process of analyzing data to discover hidden information and trends within the data. Data Mining techniques include applying algorithms and models to find patterns, rules, and useful information from the data. Tools and techniques of Data Mining help in making predictions, classifications, and detecting correlations in data.
- Data Visualization: This process transforms data into charts, graphs, maps, or other visual images. Data Visualization helps to display data visually, clearly, and understandably, helping users grasp important information and find the relationships between data.
- Reporting and Dashboards: These tools provide reports and summarized information on business performance and key metrics. Reporting provides detailed reports on business indicators, while Dashboards provide an overview and visual insight into the business situation through charts, graphs, and control panels.
Top 5 Business Intelligence Tools for Large Enterprises
Tableau
Tableau is an interactive data visualization software focused on business intelligence. Established in 2003 in Mountain View, California, and now headquartered in Seattle, Washington, Tableau was acquired by Salesforce in 2019 for $15.7 billion.

Advantages:
- Ease of Use: Tableau is ranked by G2 as one of the top 3 most user-friendly business intelligence software packages that allows for easy creation of reports and data visualizations without needing technical knowledge.
- Multiple Data Source Connections: Tableau supports connecting and integrating data from various sources such as relational databases, Excel files, cloud data, and many other data sources.
- Advanced Data Visualization: Tableau enables users to transform data into attractive, easy-to-understand, intuitive charts and graphs, facilitating the easy identification of trends and important information from data.
Disadvantages:
- Large Data Handling: Although Tableau can process large data sets, its performance may decrease with excessively large data volumes, requiring robust hardware configuration for better processing capabilities.
- High Hardware and Resource Requirements: Tableau demands powerful hardware configurations and substantial system resources to ensure optimal performance. Deploying Tableau on low-specification computers can lead to poor performance and slow response times.
- Limited Geolocation Capabilities: While Tableau offers data display on maps, its geolocation capabilities might be limited in some cases. Enterprises may need to use GIS (Geographic Information Systems) tools to fully exploit the geolocation potential.
Microsoft Power BI
Microsoft Power BI is an interactive data visualization software developed by Microsoft in 2011, with a primary focus on business intelligence.
Advantages:
- High Integration with Microsoft Ecosystem: Power BI is highly compatible with other Microsoft products and services such as Azure, Office 365, and SQL Server. This allows users to fully leverage their existing systems and easily integrate data from various Microsoft sources.
- Strong Support for DAX Language: Power BI supports the powerful Data Analysis Expressions (DAX) language, enabling users to perform complex calculations and data processing to create indices, measurements, and analytical formulas.
- Advanced Data Visualization: Power BI offers a range of charts and graphs for data visualization, including bar charts, pie charts, line charts, geographical maps, and many other visualization forms.
Disadvantages:
- Technical Knowledge Requirement: While the Power BI user interface is friendly, full utilization of Power BI’s potential requires knowledge and skills in data analysis, DAX language queries, and basic BI concepts.
- Limitations in Graphics and Customization: Power BI has limitations in interface customization and graphics. Some complex customizations might require the use of additional tools or the creation of custom extensions.
- Limitations in the Free Version: The free version of Power BI has limitations in data connection and processing capabilities, security features, and access rights, and does not allow integration with some services and complex data sources.
Looker
Looker is a popular BI system used for data visualization and analysis in large enterprises. This system allows users to access, explore, and analyze data most intuitively.

Advantages:
- Flexible Query Tool: Looker provides a powerful querying tool, allowing users to build complex query structures. Users can perform calculations, filter, and group data to obtain useful analytical information.
- Real-Time Data Integration: Looker enables users to monitor and analyze data in real-time, which is extremely useful in tracking metrics, reports, and continuous data updates.
- Automation and Scheduling: Looker offers the ability to automate data analysis processes and schedule tasks. Users can set up automatic schedules for data updates, report generation, and automatic notifications, saving time and improving work efficiency.
Disadvantages:
- Complex Configuration and Deployment Requirements: Looker requires quite complex initial configuration, demanding technical knowledge and an understanding of the system for setup and integration into the existing environment.
- Programming Skills Requirement: To fully utilize Looker’s potential, users need knowledge of programming languages like SQL and programming skills to customize and optimize queries and reports.
Amazon QuickSight
Amazon QuickSight is a serverless BI service operating on the cloud, developed by Amazon and released on February 22, 2022. Amazon QuickSight provides tools for data visualization, interactive dashboards, and machine-learning-supported data analysis.

Advantages:
- Easy to Use: Amazon QuickSight has a user-friendly interface that is easy to navigate. Users do not need deep technical knowledge to start using it, and creating reports, visualizing data, or interacting with data is quite simple.
- Well-Integrated with AWS Services: Amazon QuickSight is tightly integrated with other AWS services like Amazon Redshift, Amazon RDS, and Amazon S3. This facilitates easy access and analysis of data from AWS data sources.
- High Scalability: Built on the AWS cloud infrastructure, Amazon QuickSight allows flexible scaling and ensures high availability.
Disadvantages:
- Dependency on AWS Infrastructure: Amazon QuickSight is entirely dependent on AWS infrastructure and services. This could be a limitation if users do not want or do not have AWS infrastructure available or if they are already using other cloud service providers.
- Limited in Complex Data Visualization: While Amazon QuickSight provides data visualization tools, its capabilities in visualizing complex data might be more limited compared to other data analysis tools like Tableau, Power BI, or Looker.
ThoughtSpot
ThoughtSpot is a self-service BI system developed in 2012. This system allows users to easily search, query, and visualize data, making it a popular choice among businesses.

Advantages:
- Quick Data Retrieval: ThoughtSpot enables users to retrieve data quickly and efficiently. With its automatic search technology and code-free querying, users can search and access information from various data sources in just a few seconds.
- Self-Service and Easy to Use: ThoughtSpot is designed to make data retrieval and analysis simple and user-friendly. Users do not need technical knowledge or programming skills to understand and use it.
- Support for Cloud and On-Premise Platforms: ThoughtSpot supports deployment on cloud platforms like AWS, Microsoft Azure, and Google Cloud Platform, as well as on-premise environments. This allows businesses flexibility in deploying and using ThoughtSpot.
Disadvantages:
- Dependence on Standardized Data: If data is not standardized or has quality issues, searching and querying data with ThoughtSpot can be challenging and yield inaccurate results.
- Limitations in Handling Large Data Sets: ThoughtSpot may face limitations in processing large volumes of data. As datasets become more complex, performance and response times can be affected.
- Limitations in Customizing Reports: ThoughtSpot has some limitations in creating and customizing complex reports. Advanced features like detailed chart creation, custom calculations, and enhanced analytical functions may be limited compared to other data analysis tools.
View more: What is PIM? The 5 best PIM software for large enterprises
The above is a summary of 5 BI software options for large-scale enterprises, detailing the individual advantages and disadvantages of each system. Depending on the needs for BI system development and budget planning, businesses can consider and choose the most suitable BI solutions.
Contact SECOMM to learn more detailed information!
 2
2

 9,788
9,788
 0
0
 1
1
21/12/2023